
How Likely Is Long-Term Care, and How Long Does It Last?
The real statistics on probability and duration — and why the long tail matters more than the average
"It probably won't happen to me." This is the most common reason long-term care planning is deferred — and the most consequential one. The sentiment is understandable. Long-term care is associated with decline, dependency, and loss of independence. Thinking carefully about it feels like accepting an outcome most people prefer to avoid.
The problem is not the reluctance to plan. The problem is that the belief "it probably won't happen to me" is statistically incorrect for most people, and the financial consequences of being wrong are among the largest that retirement can produce.
This page examines the actual probability of needing long-term care, the distribution of care duration, the factors that drive the highest-cost outcomes, and the trade-off between planning for the typical episode versus planning for the catastrophic one.
The 70% Statistic — What It Means and What It Doesn't
The figure cited most frequently in long-term care discussions is this: approximately 70% of people who reach age 65 will need some form of long-term services and supports (LTSS) during their lifetime.
This statistic comes from Administration for Community Living (ACL) and HHS data and is broadly reliable — but it requires context to be useful.
WHAT THE 70% INCLUDES
The 70% figure captures anyone who needs any level of LTSS — including brief episodes of home-based assistance, informal family care without paid services, and short post-acute recovery periods. Not all of these episodes are financially significant. A three-week recovery at home after a hip replacement is included in the same category as a seven-year dementia care episode.
The more financially relevant statistics narrow the frame:
-
Approximately 48% of people turning 65 will need paid care at some point — not just informal family assistance
-
Approximately 20% will need care for five or more years
-
The average care duration for those who need paid services is 2–3 years — but this average obscures a wide distribution
The 70% figure is not inflated or misleading. It is simply broad. The planning question is not whether some care need will arise — it almost certainly will for most people. The question is whether it will be a manageable episode or a long, high-cost one.

Duration: The Average Conceals the Risk
Long-term care is not a fixed event with a predictable length. It is a distribution — ranging from brief episodes measured in months to extended care measured in years. The average sits near the middle of this distribution. The planning risk sits at the tail.
Understanding the shape of the distribution matters because the financial impact of care scales roughly with duration. A family can often absorb one or two years of care costs from savings or income. What destabilizes retirement plans is a multi-year episode with escalating acuity — the kind of episode that empties accounts that were otherwise sound.
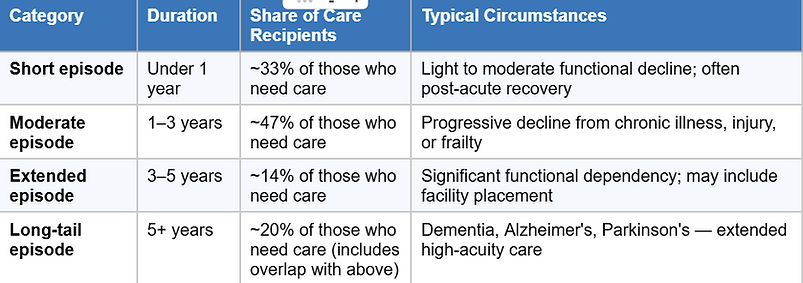
Three features of this distribution deserve attention:
First, the short-episode majority provides false comfort. Because most people who need care need it for a relatively brief time, the population-level average looks manageable. But the person in the long tail has a fundamentally different financial problem than the person in the short-episode bucket — and they have no way to know in advance which scenario they will face.
Second, the long-tail risk is not rare. One in five people who need long-term care will need it for five or more years. This is not an extreme outlier scenario. It is a statistically significant segment of the population that plans built around the average will fail to address.
Third, the tail is driven by specific conditions — primarily dementia and Alzheimer's disease — that are not evenly distributed and that tend to produce the highest-cost, longest-duration episodes.
Gender and Duration
Women and men face meaningfully different long-term care profiles. The difference is not simply biological — it reflects a combination of longevity, care setting, and family structure.
DURATION BY GENDER — ACL DATA
Women average 3.7 years of long-term care. Men average 2.2 years. Women are significantly more likely to enter nursing facility care and more likely to spend extended periods there, partly because they are more often widowed and lack an available informal caregiver (spouse) at home.
The gender gap in duration has several structural causes:
-
Women outlive men by an average of approximately five years, meaning they face a longer window of potential need
-
Women are more likely to be widowed before needing care, reducing the availability of spousal caregiving at home
-
Men who need care are more likely to receive it from a spouse and remain at home — a lower-cost setting — for longer
-
Women are more likely to enter assisted living or nursing facility care earlier in their care episode
These are population-level patterns, not individual predictions. But they are relevant context for household planning, particularly for couples evaluating how to allocate planning resources across both partners.
Alzheimer's Disease and Dementia: The Long-Tail Driver
The primary driver of extended, high-cost long-term care episodes is Alzheimer's disease and related dementias. While most care episodes are short and manageable, dementia episodes are frequently neither.
Alzheimer's typically runs 8 to 10 years from diagnosis to death, and in some cases longer. During that period, care needs escalate progressively. What begins as companion care and supervision at home may advance through personal care, memory care placement, and eventually skilled nursing — often with a corresponding escalation in monthly cost at each stage.
Several structural features of dementia care make it distinct:
-
Duration is long and largely unpredictable — some people live two years after diagnosis; others live fifteen
-
The condition does not respond to rehabilitation goals — there is no clinical endpoint that triggers Medicare coverage or signals recovery
-
Behavioral and safety issues may require secure memory care placement even when the person retains physical ability, increasing cost beyond what ADL deficits alone would indicate
-
Family caregiving burden is substantially higher than for other conditions, with documented effects on caregiver income, health, and retirement security
Dementia is not the only long-tail condition. Parkinson's disease, ALS, and severe stroke outcomes can also produce extended high-dependency episodes. But Alzheimer's disease is the most prevalent, and the planning implications of a potential dementia episode are materially different from those of the average care scenario.
'Some Care' vs. the Catastrophic Episode
The 70% statistic captures a wide range of scenarios that behave very differently from a financial standpoint. It is useful to separate them:
THE STRUCTURAL DISTINCTION
A short episode of home-based assistance is a financial inconvenience. A five-year nursing home admission with memory care placement is a financial event of a different category — one that can deplete substantial assets or trigger Medicaid spend-down. Planning that conflates the two risks over-preparing for one scenario and under-preparing for the other.
The financially significant scenario is not simply "needing care" — it is needing paid care for an extended period, at a high level of acuity, in a setting that carries substantial monthly cost. That scenario has a meaningful but not dominant probability. It is neither inevitable nor ignorable.
This is the central tension in long-term care planning: the most likely outcome is manageable; the less likely outcome is not. How to account for both in a retirement plan is a structural question, not a product question. The probability framework on this page is the prerequisite.
The Trade-Off: Planning for the Average vs. Planning for the Tail
Because long-term care duration is a distribution rather than a fixed outcome, planning involves an explicit choice about which part of the distribution to address. There is no objectively correct answer — the right approach depends on assets, risk tolerance, family circumstances, and values. But the trade-off is structural and should be named clearly.

The relevant observation is not which approach is best. It is that each approach involves a genuine trade-off, and that deferring the question by assuming "it probably won't happen" is itself a planning choice — one that defaults to self-funding whatever scenario arises, without a deliberate structure for doing so.
Why These Statistics Are Difficult to Use
EMOTIONAL ACKNOWLEDGMENT
Statistics about long-term care probability are cited frequently and believed rarely. The reason is not innumeracy — most people understand what 70% means. The reason is that the scenario is aversive enough that the mind resists assigning it personal relevance." It probably won't happen to me" is not a calculation. It is a protective conclusion. The statistics on this page do not change that response. They provide a factual frame for the people who are ready to use one.
Summary
Approximately 70% of people who reach age 65 will need some form of long-term services and supports. The more financially relevant figure is that approximately 20% will need care for five or more years — the long-tail scenario that produces the largest financial impact.
Average care duration is 2–3 years for most recipients, but this average conceals a wide distribution. Women face longer average episodes than men (3.7 years vs. 2.2 years). Alzheimer's disease and dementia drive the longest-duration, highest-acuity episodes — often 8 to 10 years or more.
The planning question is not whether some care will be needed. For most people, it will. The question is how to structure a plan that addresses both the probable (manageable) scenario and the possible (catastrophic) one. The trade-off between planning for the average and planning for the tail is the central structural question in long-term care planning.
Frequently Asked Questions
What are the odds I will need long-term care?
Approximately 70% of people who reach age 65 will need some form of long-term services and supports during their lifetime, according to ACL and HHS data. The more financially relevant question is how many will need extended paid care: approximately 48% will need paid care at some point, and approximately 20% will need care for five or more years. The 70% figure is real, but it includes brief and informal episodes that are not financially significant. The long-tail scenario — extended paid care — is less common but far more costly.
How long does long-term care typically last?
The average is 2–3 years for people who need paid long-term care services. However, this average conceals a wide distribution. Roughly one-third of episodes are under one year; roughly one-fifth extend beyond five years. The long tail — five-plus years — is driven primarily by Alzheimer's disease and other dementias, which typically run 8 to 10 years from diagnosis and produce progressively escalating care needs throughout that period.
Is long-term care more likely for women than men?
Women and men face similar baseline probabilities of needing care, but women tend to need care for longer periods. Women average 3.7 years of long-term care; men average 2.2 years, according to ACL data. Women are also more likely to spend time in nursing facility care, partly because they are more often widowed before needing care and have no available spousal caregiver at home. Men who need care are more likely to receive it from a spouse and remain in a home setting — typically a lower-cost arrangement.
Does everyone who needs long-term care need a nursing home?
No. The majority of long-term care is delivered at home, either by family members or paid aides. Assisted living and memory care are intermediate settings between home care and nursing facilities. Nursing home placement tends to occur for people with complex medical needs, advanced dementia with safety concerns, or insufficient family or home-based support. Most care episodes — particularly shorter ones — involve some combination of home-based and community-based services.
Why does Alzheimer's disease matter so much for long-term care planning?
Alzheimer's disease and related dementias are the primary driver of the long-tail care scenario — extended, high-cost episodes that can last 8 to 10 years or more. Unlike many conditions that have rehabilitation endpoints or clinical milestones, dementia involves progressive functional decline without recovery. Care needs escalate over time from supervision and personal assistance to full-time memory care and eventually skilled nursing. The combination of long duration, escalating cost, and behavioral complexity makes dementia the highest-stakes scenario in long-term care planning.
What is the difference between average long-term care and a catastrophic episode?
A typical care episode — under three years, primarily home-based — is a financial inconvenience for most retirees with adequate savings. A catastrophic episode — five or more years, progressing through assisted living, memory care, and nursing facility placement — can deplete substantial assets and trigger Medicaid spend-down. The 70% probability figure spans both categories. Planning that treats the average as the planning target is adequately funded for most outcomes but unprotected against the tail. About one in five people who need care will face the tail scenario.
Why do people underestimate their likelihood of needing long-term care?
Research on health risk perception consistently shows that people underestimate personal risk for aversive outcomes — particularly those associated with dependency and loss of independence. Long-term care triggers this pattern strongly. The statistical probability is clear; the psychological acceptance of personal relevance often lags. This is not a failure of understanding — it is a common feature of how people process unpleasant future scenarios. Planners and families frequently encounter this gap between statistical knowledge and planning action.
Should I plan for the average care duration or the long tail?
This is a genuine trade-off, not a question with a single correct answer. Planning for the average (2–3 years) costs less and covers the most likely outcome but leaves exposure to the long-tail scenario. Planning for the tail (5+ years) is more expensive but limits catastrophic risk. A hybrid approach — funding the average through assets or insurance while using legal and Medicaid planning to address the tail — is a common structure, though it requires professional coordination across financial, legal, and insurance domains. The right approach depends on assets, risk tolerance, family circumstances, and the availability and affordability of various funding mechanisms. These are addressed in following articles.
What percentage of people need long-term care for more than 5 years?
Approximately 20% of people who need long-term care will need it for five or more years. This represents roughly 14% of all people turning 65 who will need five-plus years of care that includes paid services. While this is a minority of outcomes, it is not a rare one — and the financial impact of a five-year-plus paid care episode is categorically different from a one-to-two-year episode. This segment of the distribution is the primary driver of Medicaid spend-down in nursing facility settings.
If I'm healthy, does that reduce my long-term care risk?
Current health is a factor but not a reliable predictor. Many long-term care needs arise from age-related changes, falls, strokes, or cognitive decline that occur in people who were previously healthy. Alzheimer's disease, the leading driver of extended care episodes, is not consistently predicted by earlier health status. The 70% population-level probability accounts for the full age-65 cohort, including people who are healthy at that point. Good health reduces near-term risk but does not eliminate long-term exposure.
This page does not predict whether any individual will need long-term care, for how long, or at what level. It does not recommend a planning approach, a funding mechanism, or a product. It does not assess individual health, family history, or financial circumstances.
It presents population-level statistics on probability and duration, explains the distribution of care episodes, identifies the conditions that drive the highest-cost outcomes, and names the planning trade-off between average and tail scenarios.
Every subsequent page in this series — on costs, Medicare, Medicaid, legal instruments, and funding mechanisms — builds on this probability foundation.
This page is part of the WSN Reference Library, a first-principles financial education resource. It explains — it does not advise.